Question 2: Explain the displacement-time graph and velocity-time graph. In each type, give brief details along with appropriate diagram for illustration.
Answer
Displacement-time graph and velocity-time graph enable us to have an in-depth analysis of various parameters of motion.
Displacement-time graph
Displacement-time graph is depicted with displacement on the vertical or y-axis and time on the horizontal or x-axis. The points on the graph show the displacement of the object from a certain fixed point at the corresponding interval of time.
Let’s further analyze the motion of a body by displacement-time graph.
(i) Uniform velocity
In figure (a), a graph is plotted to describe the motion of uniform velocity of a body which starts from point O and reaches point A by covering 100 m of straight distance. Let it takes a time of 10 seconds to reach there.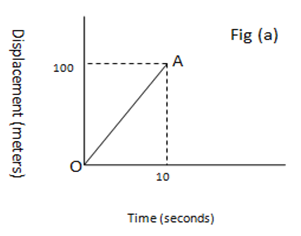
The graph is a straight line.
![]()
Velocity = slope of the graph, is constant throughout the line.
Thus in the case of uniform velocity, the displacement-time graph is a straight line and its slope gives the velocity of the object.
(ii) Variable or non-uniform velocity
In case the body is moving with non-uniform velocity, its velocity will be either 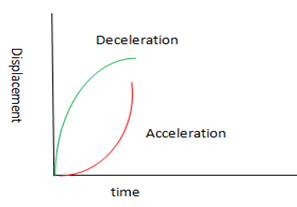 increasing or decreasing.
If the velocity is non-uniform with time, the graph of the displacement-time relation is a curve. If the velocity is increasing with time, the slope of the graph also increases and the body is accelerating.
If the body is decelerating or slowing down, the slope of the graph is decreasing.
(b) Velocity-time graph
The graph is laid out by plotting the velocity on y-axis and time on x-axis. Such a graph gives us important information about the acceleration of the body and the distance covered.
(1) Acceleration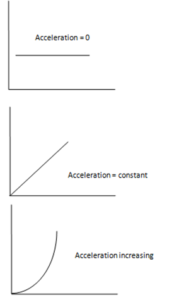
Slope or gradient of the V-T graph is the acceleration of the motion. If the V-T graph is a curve with increasing slope, it means the acceleration is positive and the velocity is increasing.
If the V-T graph is a curve and the slope is decreasing, it means the acceleration is negative and the velocity is decreasing.
If the V-T graph is a straight line parallel to the x-axis, this means there is no change in the velocity of the object with time.
Velocity is constant and acceleration is zero. The slope of the curve is also zero.
One another important use of the V-T graph is to find the instantaneous acceleration of the object.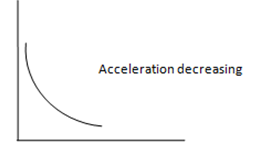 It is calculated by finding the slope of the tangent to the V-T graph at a required point of the curve.
(2) Distance Covered
Distance covered is found by calculating the area under the graph, i-e, between the graph line and the time axis.
Pingback:index-long-questions-ch3