Question 2: Draw and describe a stress/strain graph and identify the elastic region, plastic flow region, yield stress and ultimate tensile stress.
ANSWER
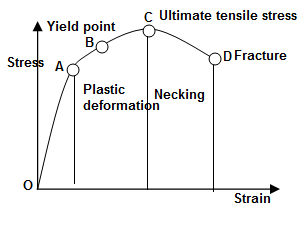
The stress-strain graph gives the amount of strain produced in an object for a certain stress applied to it. The graph is obtained by gradually increasing the stress and noting the change in the length. The values are then plotted on a graph. The following curve shows the relations for a ductile material like iron.
(1) From O to A the curve is linear. Hook’s law
is obeyed in this region and the body regains its original shape when the force is removed. The object behaves like an elastic body.
(2) In region from A to B,
پواينٹ سی کے بعد تار کو مزید نہیں کھینچا جاسکتا (اوپر فگر میں )اّس لیۓ کہ اس کے ٹوٹنے کا عمل شروع ہوجاتاہے۔ شروع میں تار کے درمیان میں ایک نکتے پر غیرمتناسب طریقے سے زیادہ زور پڑتاہے۔ اور وہ جگہ پتلی ہوجاتی ہے۔ اس پتلی جگہ کو انجينیرنگ میں نک یعنی گردن کہتے ہیں۔ اور پوايینٹ سی اور ڈی کے درمیان ایریا کو نکنگ ایریا۔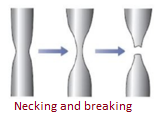
the object regains its shape when the stress is removed, however, the stress and strain are not proportional. We say, Hook’s law is not obeyed. Point B is called the elastic limit or the yield point. The corresponding stress is called yield strength.
(3) When the force is further increased beyond point B, the strain increases rapidly for a small stress. This region is called the plasticity of the object. The point C is the ultimate tensile strength (which means the maximum limit of extension of the object).
(4) Increasing the force further, the material is permanently changed and the body does not regain its original shape. At point D, the material cannot be stretched further and a small increase in the stress can break the material.
When point C and D are close to another , the object is said to be brittle (means breaking easily) otherwise a ductile (spongy or soft).
Stress strain curve has important applications in engineering works. This helps us to understand how a given material will deform with increasing the load.
Pingback:Valence band, conduction band, forbidden energy gap and energy level diagram – msa
Pingback:tensile-and-compressive-forces – msa