Question 12: Sketch the graph of potential difference against time for (a) discharge of a capacitor (b) charging of a capacitor.
ANSWER
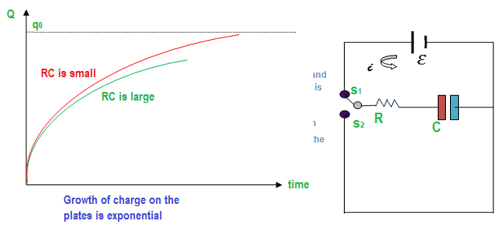
 Consider an RC circuit as shown in the diagram.
Here V0 (ε) is the voltage of the applied source, C is the capacitor and R is the resistance. S1 is the switch for charging the capacitor and S2 is the switch for discharging it.
Consider an RC circuit as shown in the diagram.
Here V0 (ε) is the voltage of the applied source, C is the capacitor and R is the resistance. S1 is the switch for charging the capacitor and S2 is the switch for discharging it.

Divide both sides by C,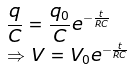 Where V is the instantaneous potential and V0 is the maximum potential difference. e is the Euler’s constant = 2.718 and RC (Resistance * Capacitance) is the time constant.
The Q-T sketch of the function is as above.
Where V is the instantaneous potential and V0 is the maximum potential difference. e is the Euler’s constant = 2.718 and RC (Resistance * Capacitance) is the time constant.
The Q-T sketch of the function is as above.
 Initially, at t = 0, the charge on the capacitor is zero. When the switch S1 is closed the charge flow is set up, accumulating charge on both plates. The charge builds up untill a quantity q0 deposits on both plates. However, with the passage of time, the flow of charge through the circuit also decreases. Experimentally found value of instantaneous charge on the plates is,
Instantaneous value of charge on plates during charging
Initially, at t = 0, the charge on the capacitor is zero. When the switch S1 is closed the charge flow is set up, accumulating charge on both plates. The charge builds up untill a quantity q0 deposits on both plates. However, with the passage of time, the flow of charge through the circuit also decreases. Experimentally found value of instantaneous charge on the plates is,
Instantaneous value of charge on plates during charging  Divide both sides by C,
 The above equation can be sketched as above.
This equation gives the discharge of a capacitor.
The above equation can be sketched as above.
This equation gives the discharge of a capacitor.
Consider an RC circuit as shown in the diagram.
Here V0 (ε) is the voltage of the applied source, C is the capacitor and R is the resistance. S1 is the switch for charging the capacitor and S2 is the switch for discharging it.
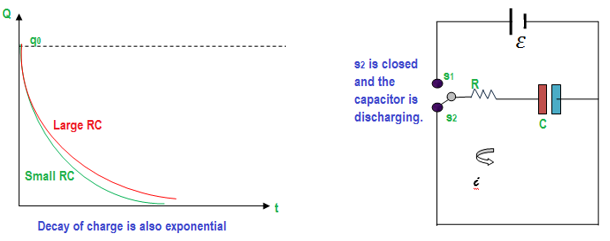
Graph for the discharge process
Suppose the capacitor is fully charged with charge +Q on the plate to the left and -Q on the plate to the right. Let switch S2 is closed and the flow of charge happens through resistor R. Initially, when the capacitor is charged to the maximum, the flow of charge or current takes place rapidly. However, as charge neutralizes one another at the oppositely charged plates, the voltage between the plate’s decreases. Experimentally, it is found that the potential difference decreases exponentially and follows the equation. Instantaneous charge of the plates=Divide both sides by C,
Where V is the instantaneous potential and V0 is the maximum potential difference. e is the Euler’s constant = 2.718 and RC (Resistance * Capacitance) is the time constant.
The Q-T sketch of the function is as above.
Charging of the capacitor
Initially, at t = 0, the charge on the capacitor is zero. When the switch S1 is closed the charge flow is set up, accumulating charge on both plates. The charge builds up untill a quantity q0 deposits on both plates. However, with the passage of time, the flow of charge through the circuit also decreases. Experimentally found value of instantaneous charge on the plates is,
Instantaneous value of charge on plates during charging
The above equation can be sketched as above.
This equation gives the discharge of a capacitor.
Pingback:index-sq11-p12 – msa
Pingback:Compare formulae for capacitors and resistors in series and parallel … msa – msa
Pingback:p-d-across-resistor-in-r-c-circuit – msa