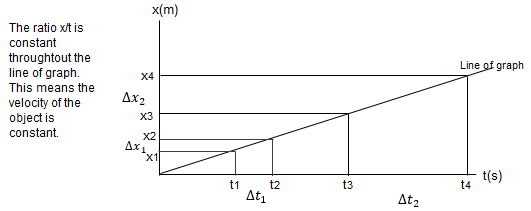
Consider the graph to the right.
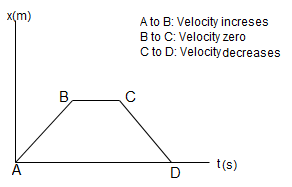
When the motion is varying, i-e, some time the velocity is increasing and some time it is decreasing, the slope of the curve is also increasing or decreasing in the same way. AB portion of the graph shows a constantly increasing velocity. BC portion shows the slope or steepness is zero and the body is at rest. CD portion shows a negative slope slowly increasing. Hence the car has reversed its direction until it reaches to zero displacement at D.
Pingback:Velocity-time graph
Pingback:Comprehensive Questions, Forces and Motion, Physics Grade 11