Menu Close

Question 1 (b): Explain velocity-time graph with illustrations.

Answer

Analysis of velocity time graph

Graph between velocity of a moving body and time is called velocity-time graph of the body.

v-t graph gives us the important information about the motion of the body. The most important uses of this graph are (i) its slope or gradient gives us the acceleration of the body (ii) using v-t graph, we can find the distance travelled by the moving body during a certain time.

Study of different types of v-t graphs

Constant velocity graph

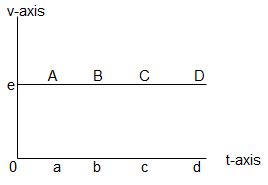
When a body is moving with constant velocity, the v-t graph is a straight line parallel to t-axis. Its slope or steepness is zero. In the adjacent figure, constant velocity v-t graph is shown. Find the slope of the graph between any of the two points (or any point) like a and b and see that,

Since slope of the v-t graph is acceleration, therefore, acceleration is zero.

You can find the slope of graph at any point to verify that slope = acceleration = 0 everywhere on the graph.

v-t graph with constant acceleration

In such a graph, the slope is constant at any point. The graph is a straight line.

  • When the velocity of the object is increasing with constant rate, the slope is positive and constant which shows constantly increasing acceleration.
  • When the velocity of the object is decreasing with constant rate, the slope is negative and constant which shows constantly decreasing acceleration.

Variable velocity-time graph

If the object is moving with variable velocity, the slope of the v-t graph varies at each point. The graph is a curve. See the diagram.

  • If the slope of the graph increases, this means the acceleration of the body increases.
  • If the slope of the v-t graph decreases, it means the acceleration of the body decreases.

1 Comment

  1. Pingback:Displacement-time graph

Leave a Reply

Your email address will not be published. Required fields are marked *