Menu Close

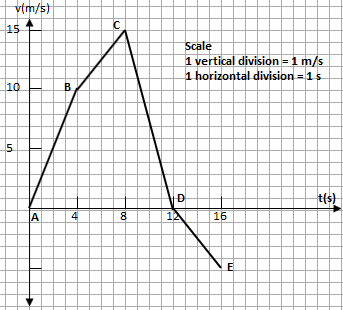
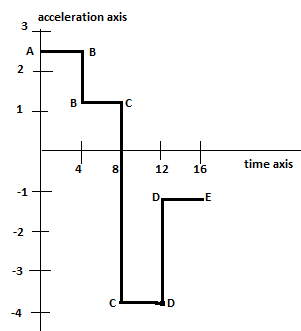
Example 3.1: The velocity-time graph shows the motion of bicyclist in a straight line. (a) From the slope of the graph, calculate the acceleration of the bicyclist between segments A and B, B and C, C and D and D and E. (b) Calculate the average acceleration of the bicyclist. (c) Plot the acceleration time graph for this motion.

Solution

Concept: Acceleration of the cyclist will be determined by the slopes of corresponding segments of the graph. Slope is the ratio of change in velocity to change in time; slope = Δv/Δt.

  • Acceleration from point A to point B:  Change in velocity, Δv = vB – vA = 10 – 0 = 10 ms-1

                                                                             Change in time, Δt = tB – tA = 4 – 0 = 4 s

  • Acceleration from point B to point C:

    Change in the magnitude of velocity, Δv = 15 – 10 = 5 ms-1

                                          Change in time, Δt = 8 – 4 = 4 s

  • Acceleration from point C to point D

         Change in the magnitude of velocity, Δv = vD – vC = 0 – 15 = – 15 ms-1

         Change in time, Δt = Δt = tD – tC = 12 – 8 = 4 s

  • Acceleration from point D to point E

         Change in the magnitude of velocity, Δv = vE – vD = – 5 – 0 = -5 ms-1

         Change in time, Δt = tE – tD = 16 – 12 = 4 s

(b) Average acceleration would be the slope of the graph line from A to E.

Change in velocity, Δv = vE – vA = -5 – 0 = – 5 ms—1

Change in time, Δt = 16 – 0 = 16 s

(c) Acceleration time graph

1 Comment

  1. Pingback:Numerical Problems on Forces and Motion

Leave a Reply

Your email address will not be published. Required fields are marked *